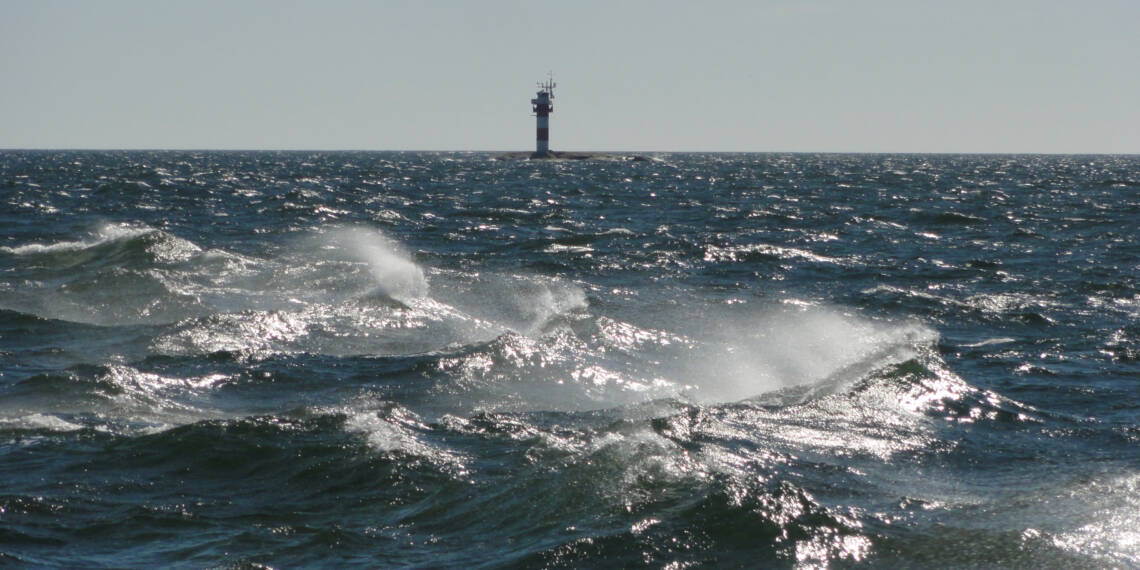
Weather and ice on the Baltic Sea
Weather and ice conditions on the Baltic Sea change continuously. Weather, sea level, wave height and water temperature are actively monitored with automatic observation stations. Satellites provide information of ice conditions, for example. Ice is also monitored with manual measurements.
Weather
The Finnish Meteorological Institute has over 30 automatic weather stations along Finland’s coastline and outer archipelago. The coastal weather stations send data on wind direction and speed every 10 minutes. Most weather stations also measure air temperature, humidity, pressure, visibility and cloudiness.
Read more about weather
Water level
The Finnish Meteorological Institute measures water level with mareographs. The institute operates 14 station on the Finnish coast. The stations are located close enough to each other to monitor water level variations throughout the coastline of Finland.
Read more about water level
Wave height
The Finnish Meteorological Institute measures wave heights with several wave buoys on the Bothnian Bay, Bothnian Sea, Northern Baltic Sea and the Gulf of Finland. The institute also cooperates with the City of Helsinki and monitors wave heights near Suomenlinna. The wave buoys are collected to storage before the sea freezes and re-installed once the ice melts. In addition to wave heights, the buoys provide data the surface temperature of the water.
Read more about wave height
Water temperature
The Finnish Meteorological Institute monitors water temperature with a variety of observation equipment. The buoys on the coast and open sea are deployed in spring and collected into storage in the autumn before the sea starts to freeze. Mareographs, located right on shore, also measure water temperature. The temperature sensors are installed at a fixed depth near the mareograph, usually around 2–3 metres below the mean water level.
Read more about water temperature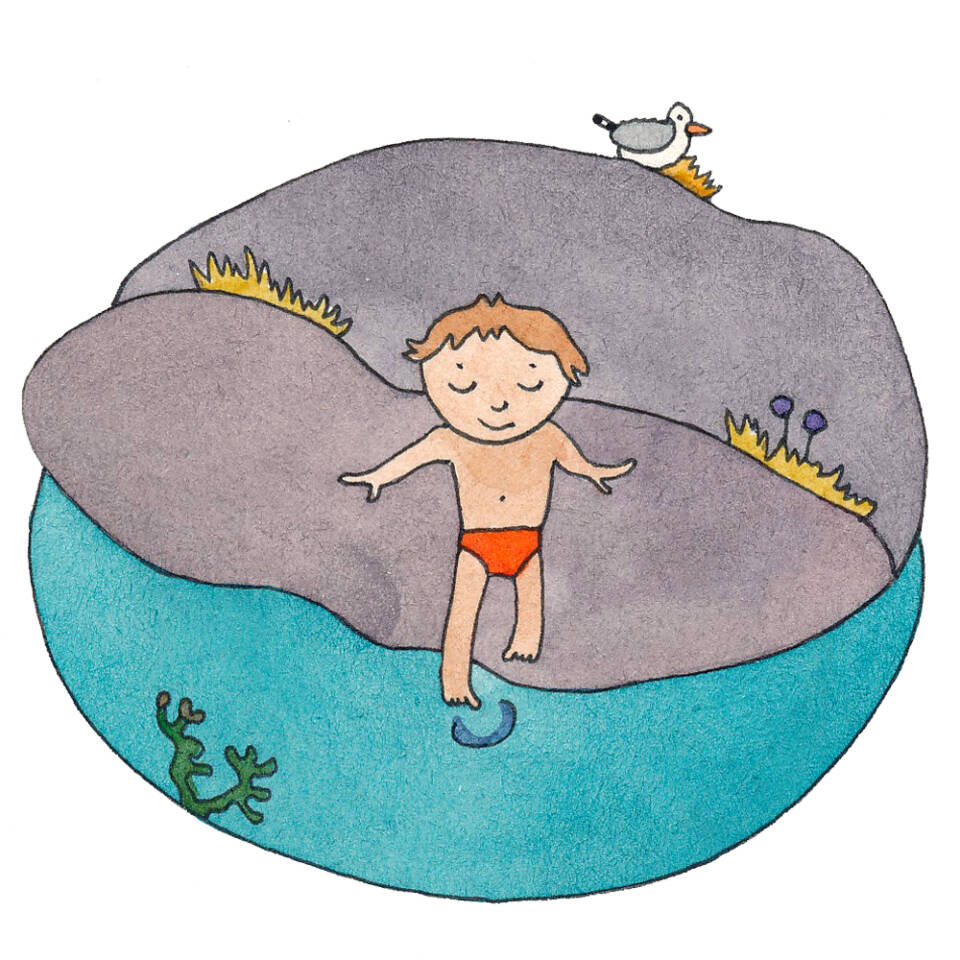
Ice thickness
A human observer measures the thickness of ice cover, and the depth of snow on top of it, once a week. The thickness of ice varies greatly, which is why three ice samples are drilled at each observation station every time. The amount of observation stations depends on the ice situation. Data collected with the samples is used to make an ice chart.
Read more about ice conditions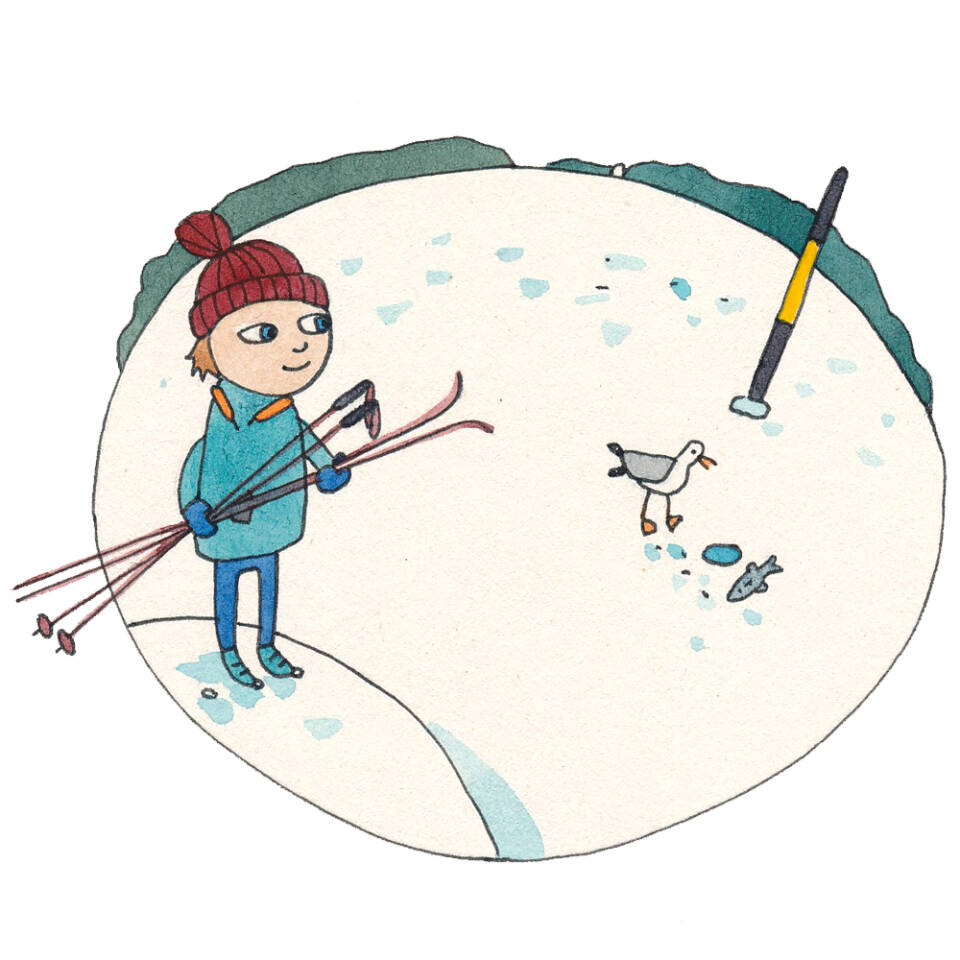
-
 Siirry palveluun
Seaguide.fi (siirryt toiseen palveluun)
-
 Find out more
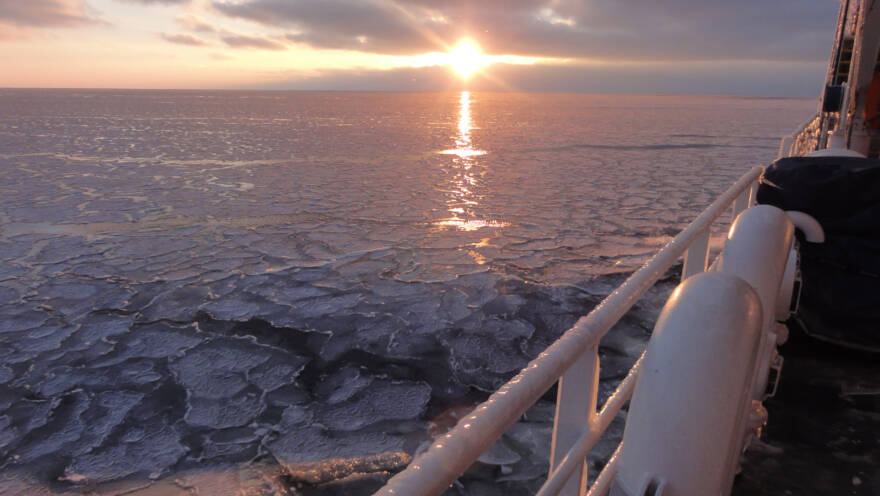
Sea ice