The load has decreased, but eutrophication does not ease
Eutrophication of the Baltic Sea accelerated after World War II, as industrialisation, urbanisation, and intensified agriculture increased the sea’s nitrogen and phosphorus load. Since then, the load has decreased. However, the progress has not been fast or strong enough to improve the sea’s condition.
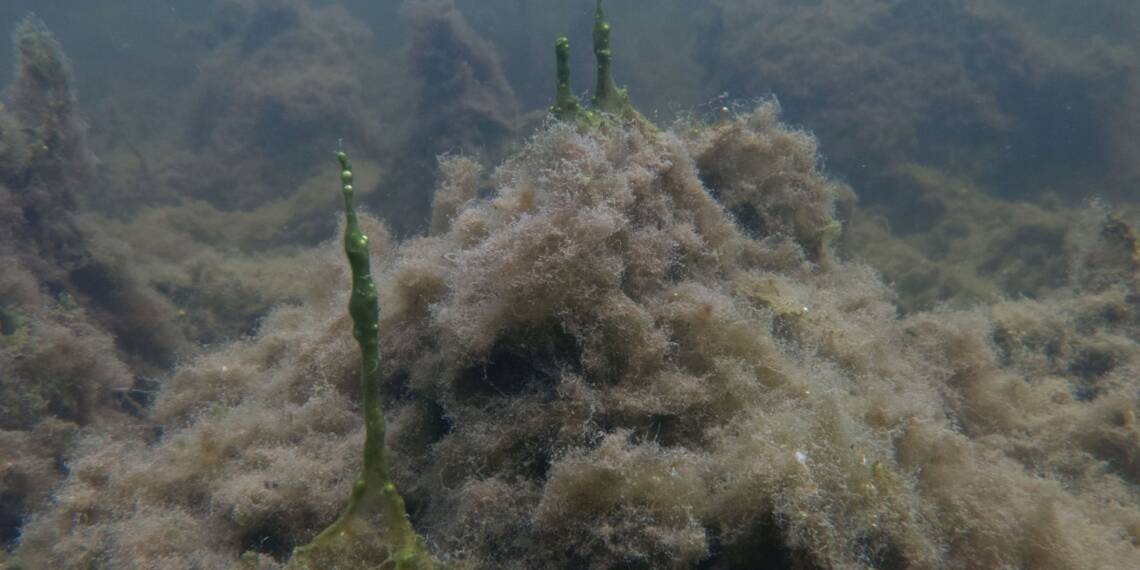
Eutrophication affects all marine areas surrounding Finland. The most concerning situation is in the coastal areas of the Gulf of Finland and the Archipelago Sea. Among the open sea areas, the Gulf of Finland and the northern part of the Baltic Sea’s main basin are in the poorest condition. The Bothnian Bay is the least eutrophicated of Finland’s marine areas, but its condition has also deteriorated.
The signs of eutrophication have not diminished
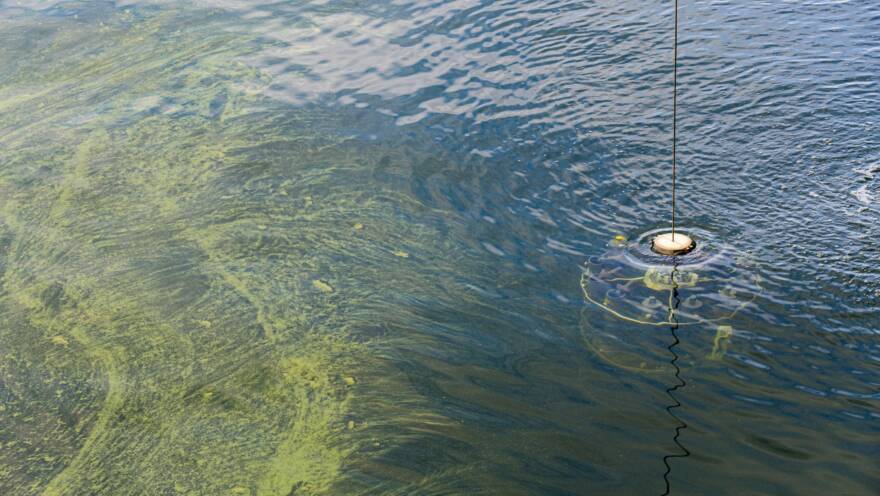
Eutrophication causes water turbidity and mass occurrences of blue-green algae. The turbidity is indicated by the fact that visibility depth is poor in almost all marine areas, and there has been no positive development recently. All open sea areas, except for the Bothnian Bay and the Kvarken, are also in poor condition regarding blue-green algae. The mass occurrences of blue-green algae, or blooms, are often very extensive and abundant, although annual variations are significant.
Turbidity and blue-green algae blooms are caused by the high nutrient content of the water. In all of Finland’s open sea areas and the majority of coastal waters, the nitrogen and phosphorus concentrations in the water exceed the threshold values set for good sea condition. Too many nutrients still flow into the sea, maintaining eutrophication.
Diffuse pollution continues strong
The majority of nutrients ending up in the Baltic Sea are from diffuse pollution, originating from agriculture, forestry, scattered settlements, and stormwater from urban areas within the catchment area. Nutrients are carried to the sea by rivers.
In all Finnish marine areas, agriculture is the largest source of nutrient pollution. The phosphorus and nitrogen pollution caused by agriculture has not significantly decreased in any marine area over the long term.
Although diffuse pollution has not significantly eased, the total load from Finland to the sea has decreased between 1995 and 2024 – by an average of about 10,000 tonnes per year for nitrogen and about 1,000 tonnes per year for phosphorus. This is mainly due to the reduction of emissions from point sources, such as coastal cities and industries. There is also a slight decrease in diffuse pollution over the long term.
Point source pollution has been effectively brought under control
Point source pollution has decreased as wastewater treatment has improved. Positive development began after the 1970s and has continued until recent years. Especially phosphorus emissions from point sources have reduced to a fraction of their previous levels. Removing nitrogen from wastewater is more challenging than phosphorus, but this has also been successfully achieved. Nitrogen is removed intensively, particularly in coastal areas where nitrogen limits algae growth.
In the Gulf of Finland, the wastewater from St. Petersburg also plays a significant role. Phosphorus pollution in the Gulf of Finland decreased significantly after the wastewater treatment in St. Petersburg was enhanced in the early 2010s.
Indicators measure eutrophication
Eutrophication of the Baltic Sea is monitored using several indicators. These indicators help assess the sea’s condition in relation to the goals set by the EU. Each indicator has a target level that must be achieved for the sea’s condition to be defined as good in that respect. By conducting the same measurements year after year, the direction of development can also be determined.
Important indicators of eutrophication include visibility depth, blue-green algae blooms, bottom oxygen levels, and the concentrations of nutrients, namely nitrogen and phosphorus, in seawater. Additionally, nutrient loads to the sea are measured.
All these indicators are monitored by marine area. Although the development is positive in some of Finland’s marine areas, no marine area yet achieves the EU-defined good status in terms of eutrophication.
-

-
 Find out more
Monitoring the state of the Baltic Sea

