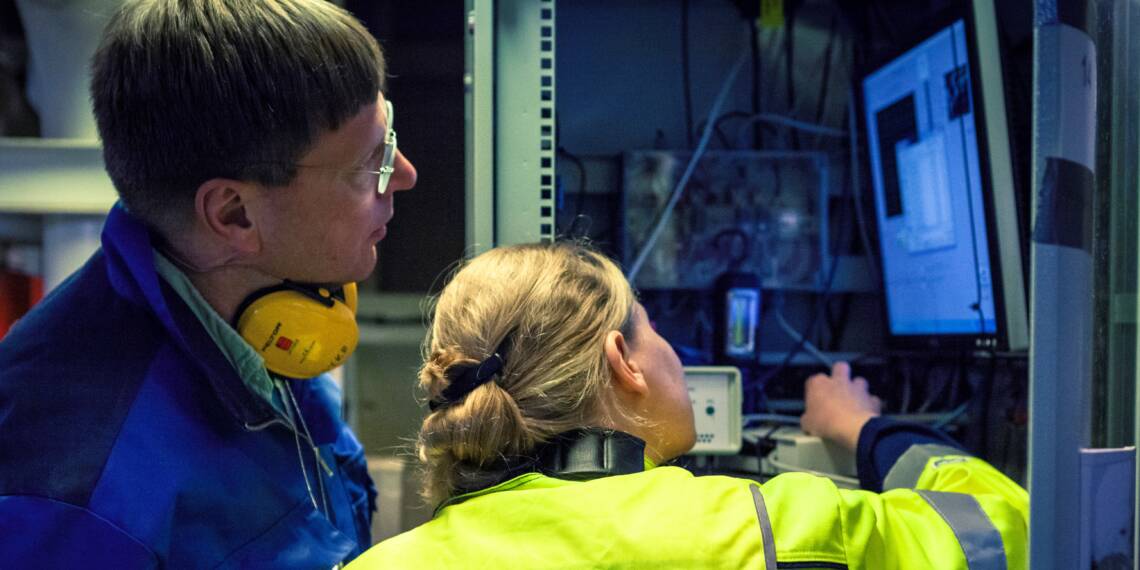
Indicators used to monitor the Baltic Sea
The state of the Baltic Sea is monitored with a variety of indicators. Find out more about the indicators and see the data associated with them. The data is updated daily!
Water temperature
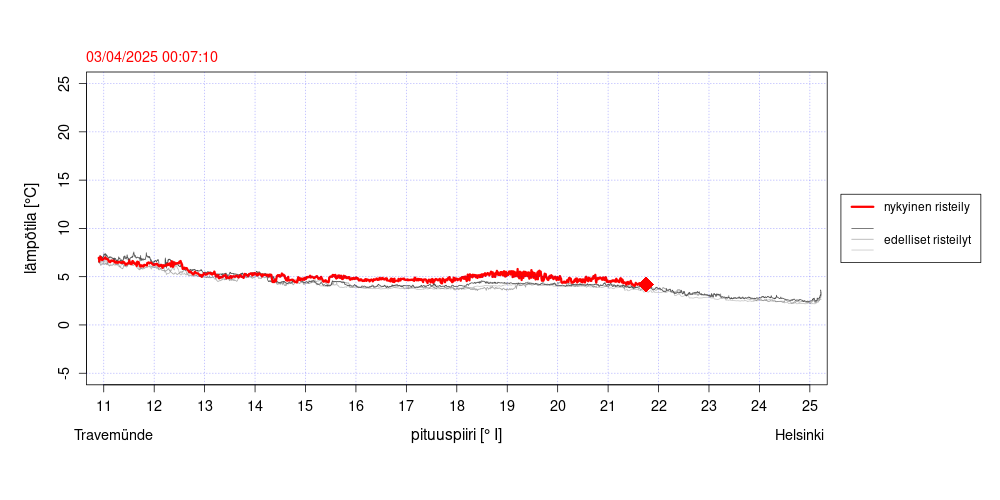
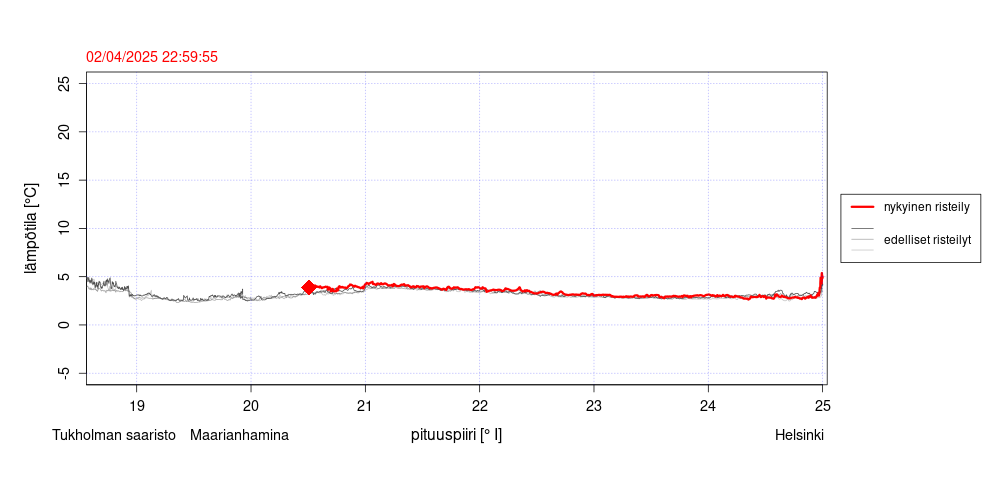
Temperature observations measured on ferries during the last week between Helsinki-Travemunde. Map is showing the current position of the ship making the measurements and the latest observations. The color of the route indicates the temperature on the shipping route.
Salinity
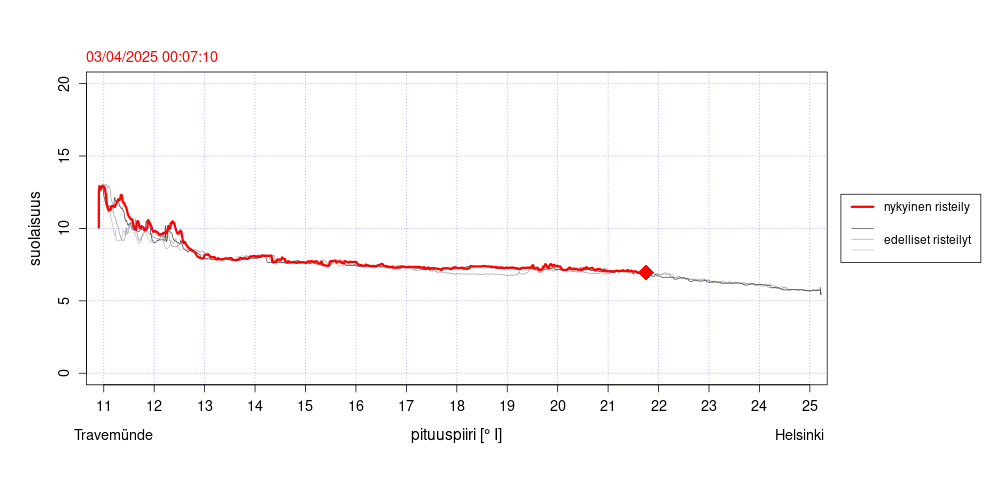
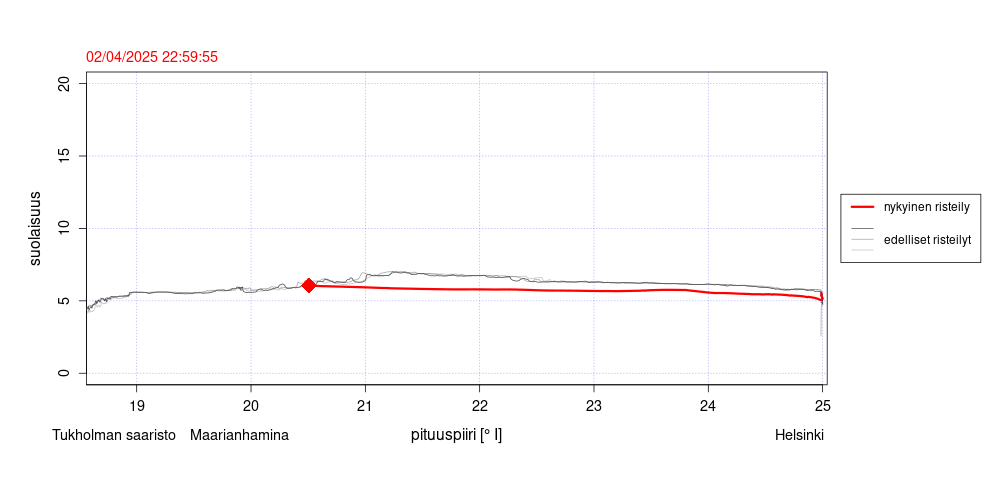
Salinity observations measured on ferries during the last week between Helsinki-Travemunde. Map is showing the current position of the ship making the measurements and the latest observations. The color of the route indicates the salinity on the shipping route.
Algae observations
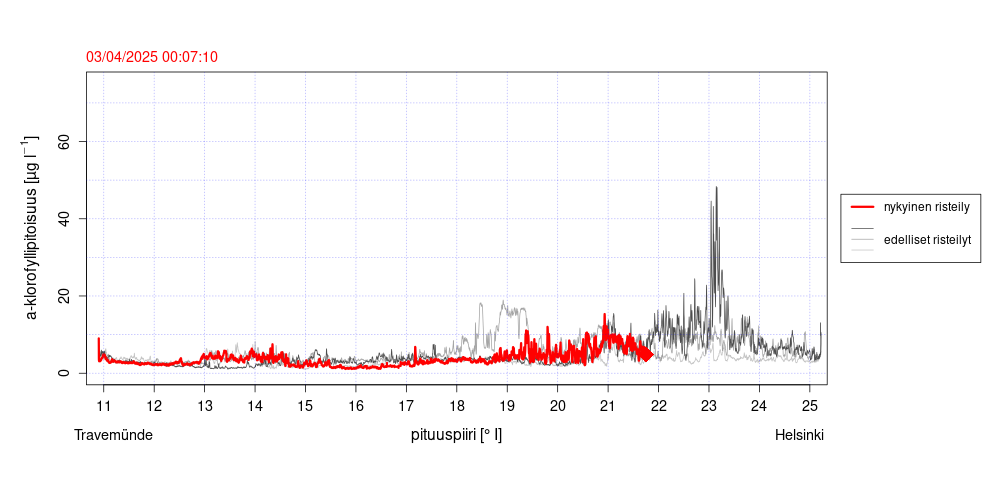
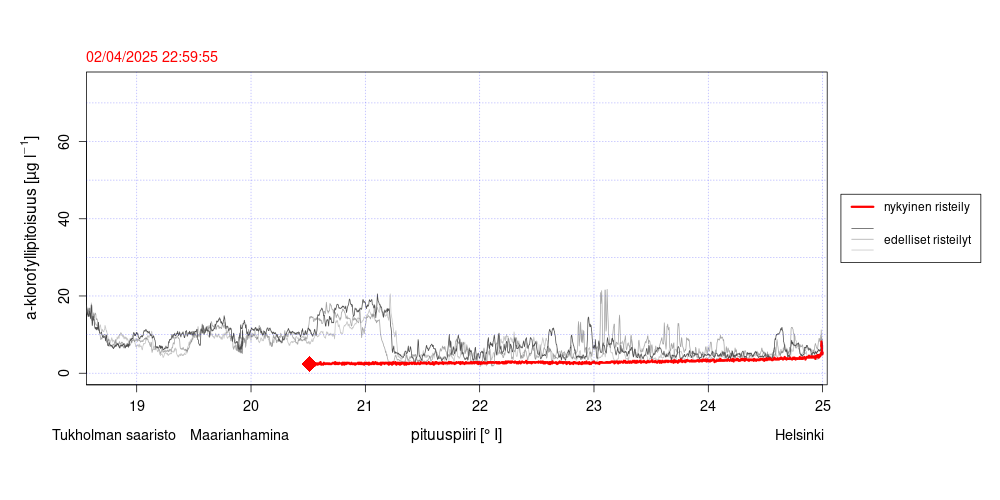
Chlorophyll observations (algae) measured on ferries during the last week between Helsinki-Travemunde. Map is showing the current position of the ship making the measurements and the latest observations. The color of the route indicates chlorophyll concentration on the shipping route.
Amount of blue-green algae
Amount of blue-green algae (phycocyanin concentration) measured on ferries during the last week between Helsinki-Travemunde. Map is showing the current position of the ship making the measurements and the latest observations. The color of the route indicates amount of blue-green algae on the shipping route.
Turbidity
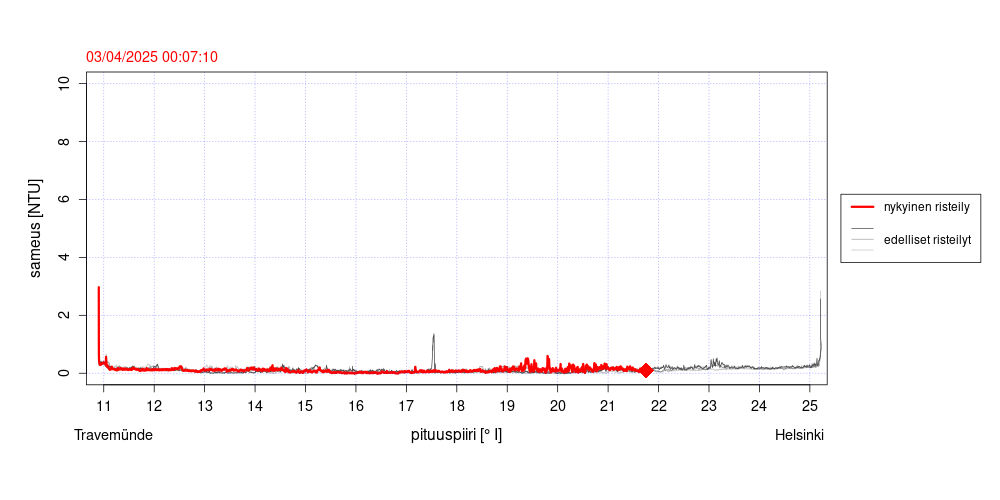
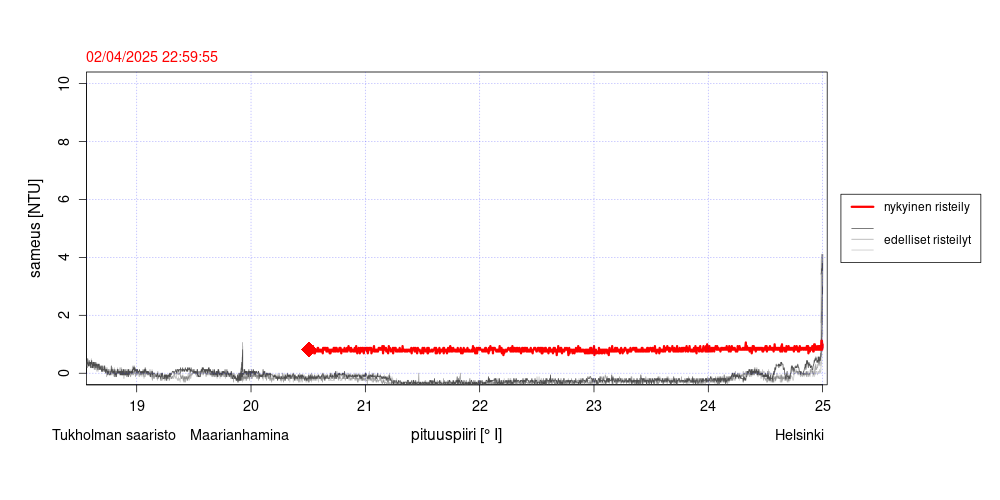
Turbidityobservations measured on ferries during the last week between Helsinki-Travemunde. Map is showing the current position of the ship making the measurements and the latest observations. The color of the route indicates turbidity on the shipping route.
The data has been produced in cooperation with JERICO-RI, the research infrastructure for European coastal waters (Joint European Research Infrastructure network for Coastal Observatory).

