Where does the data from the meters come from and what do they represent?
Water level observations and water temperature observations come from mareographs or tide gauges, which are water level measurement stations. The stations are located along the coast. Water levels are reported in the N2000 system. The readings indicate how much the water is above or below the average level. The sensor measuring water temperature is fixed at a depth of 2-3 meters on the tide gauges, ensuring it is always underwater regardless of water level fluctuations.
Read more about N2000 system: Sea level height systems in Finland(siirryt toiseen palveluun)
The wave height reading indicates the significant wave height measured by a wave buoy, which corresponds to the visually observed wave height. Wave buoys are lifted out of the water for the winter season, so observations are not always available. During the winter season, some of the meters on the Baltic Sea now page are greyed out for this reason. Wave buoys are located in the open sea. There are no wave buoys in the Archipelago Sea and Åland Sea.
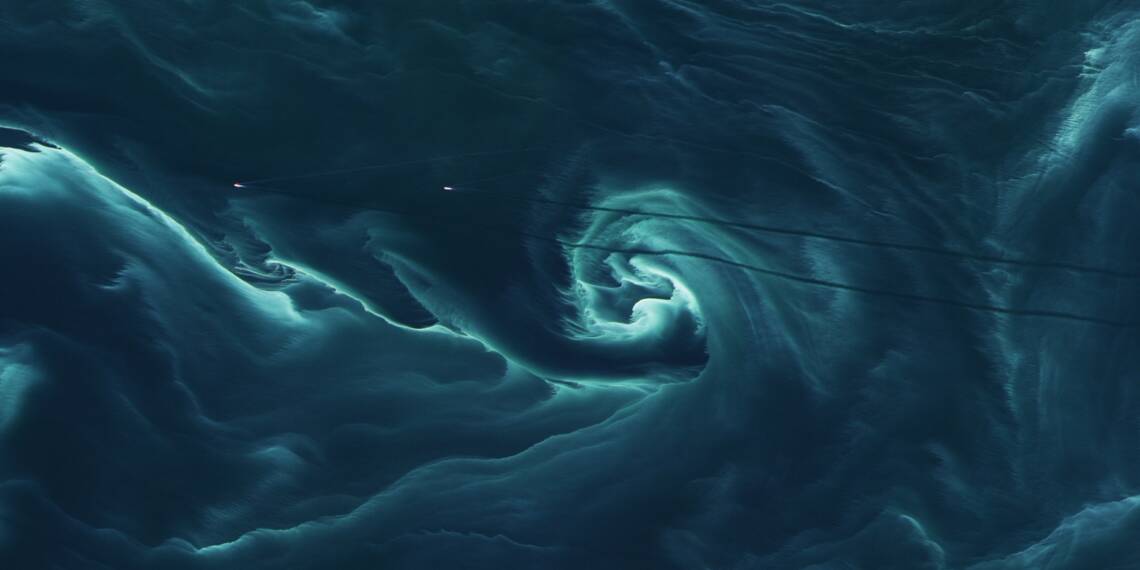
The algae bloom and visibility depth meters are based on satellite observations and automatic measuring devices on route ships for each marine area. Satellite observations are comprehensively collected from each marine area on cloudless days. Automatic observations from ships are obtained daily or every few days from the Archipelago Sea, Åland, the Gulf of Finland, and the main basin of the Baltic Sea. No observations are obtained from route ships in the Bothnian Bay and the Bothnian Sea.
The algae blooms meter is based on the chlorophyll a concentration, which indicates the amount of algae in the area and is highest in spring and midsummer. The meter particularly reflects the intensity of algae blooms in the open sea area. In midsummer, the meter mainly indicates the amount of cyanobacteria and green algae. In spring, the algae species are mainly dinoflagellates and diatoms. There is regularly a lot of algae in spring and often also in July-August.
The visibility depth meter indicates the average water clarity in the marine area. Observations for each marine area come from near the coast. Changes in visibility depth in coastal waters are greatest after heavy rains and during the spring melt when river waters bring a lot of turbidity to coastal waters. Additionally, strong winds on the coast stir up material from the bottom, temporarily reducing visibility depth. In summer, during cyanobacteria blooms, visibility depth is occasionally low. Visibility depth is highest after a long period of dry and calm weather and in late autumn and winter when there is little algae in the water